Drafts: Advanced Logging
25 Jul 2020When developing JavaScript for drafts, logging to the console or using well-placed alerts and other visual indicators can be useful for what is going on, but a more advanced logging solution can make things much easier. The latest update to the ThoughtAsylum Drafts Library includes a new class that provides functionality to help Drafts action creators with their testing.
The ThoughtAsylum Drafts Library
The library, also known as TADpoLe, is described on its own page on this site. It is in effect a collection of functions and data structures intended to make writing Drafts actions involving scripting a little easier by providing pre-built functions. Hundreds of them in fact.
The library is documented, and you can get easy access to the documentation at tadpole.thoughtasylum.com, and if you are familiar with the Drafts scripting documentation, then using this documentation will be no different.
The Class
The new class in the library that is used for these logging features is TadConsole, and you can access the base documentation for this class on it’s page as tadpole.thoughtasylum.com. However, it probably isn’t immediately clear from the documentation how it can be made use of, which is what this post will cover.
The Premise
Basic logging just outputs a piece of text and probably a timestamp. This more advanced logging does a bit more than that.
An instance of the TadConsole class captures what can be thought of as three sets of data:
- Data about the instance - where it is saved to when saved to file, and when it was last saved.
- Log data - the log entries, when they occurred, and a couple of additional classification options.
- Data about what was last being processed - information about the draft being processed, and the action being used to process it.
The TadConsole instance gets populated with this information, and then we can query the object to give us the details. This includes being able to query the log and just get back particular types of log entries (e.g. those tagged as errors), or to get them in a specific order (e.g. reverse chronological order).
You have the choice of outputting the log entries to file with every addition, at the very end of processing, or even not at all.
The class also provides functions to access the log entries in a number of ways.
Functionality
ThoughtAsylum Action Group
A handful of additions have been made to the ThoughtAsylum action group to demonstrate some of the logging functionality, so ensuring that you have the latest copy of the action group from the Drafts Action Directory is advisable if you want to quickly start experimenting.
Creating a New Logging Object
When you include the library in your scripts, it will automatically include am instance of TadConsole called tadcon. You can make use of this anywhere you see fit, but you can create other separate instances too.
When creating a new instance, you must specify a location for where the object’s content will be saved if it is saved to file. Note that the format of the file is JSON.
For example, tadCon is defined defined in the library like this.
var tadCon = new TadConsole("/Library/Scripts/tadcon.json");
It is important to note, that if there is already a file at that location, the object instance will initialise with the content in that file. This means that unless you take steps to clear the log in some way, you will be appending to a previous log. This is intentional, and can be rather useful.
Adding to the Log
When adding an entry to the log, the base method is to do so something like this.
tadCon.TA_addEntry("Log something happening");
This will add the log entry to the tadCon instance.
But, you can add additional information. For example, we’re probably all familiar with a 404, page not found error on the web. We could log something like this using the same function, but utilising some additional parameters.
tadCon.TA_addEntry("Accessing http://tadpool.thoughtasylum.com failed", "ERROR", "404");
The second parameter is a type. I like using standard sort of log entry types like “INFO”, “WARN”, and “ERROR”, but you can use whatever you like and it is a way of classifying your log entries.
Similarly the third parameter is a code, and is just another way of classifying. You can use them in combination, for example if you had a 404 code for a warning too, or maybe use unique codes if you want to be able to filter uniquely on just the one field. I tend to do the latter, so above I’d probably specify a code of “E404”. Then if I want to look at errors I can filter by type, and for a specific error, I can filter by code alone.
Keep in mind that every time TA_addEntry() is called above, it is just adding the entry to this tadCon instance. When the action completes, that instance is discarded, along with all of the data it contains.
Saving to the Log File
One thing you can do before the action completes is to save the TadConsole instance to file. Remember you have to define a location for that file when you create the instance.
To save to file you can simply do this.
tadCon.TA_saveLog()
You could also combine your last log entry addition with a save, or even log everything to file as you go by doing this.
tadCon.TA_saveEntry("Processing Complete", "INFO", "I-END");
Remember that once saved, if you create a new instance of TadConsole in a subsequent action, and it is pointed to the same file location, you’ll be appending to an existing log and not starting a new one.
Clearing a Log
If you do want to clear a log, then you have three options.
The first is once the TadConsole instance has been created, to wipe out it’s log property, which is where it hold all of the log information. There’s a function to do it safely.
tadCon.TA_clearLog();
Now this will only clear the object instance. It won’t affect the file. Often you will simply update the file once you are ready to save one or more entries to it. Should you want to clear and save in one call, you can do it like this.
tadCon.TA_clearSaveLog();
The final option is a little different. It doesn’t affect the TadConsole instance at all. It only affects the file, and not just the log data. There’s an option to quickly delete the log file too, which can be handy for tidying up, particularly when you really don’t want to have to dig into the Files app on your iPhone to manually clear a log file out.
tadCon.TA_deleteLog();
Snapshot
If you are regularly clearing files, but want to archive them, you can take a snapshot which will save a copy of the file prefixed with a timestamp of the date and time the snapshot was triggered.
tadCon.TA_snapshot();
JSON
As I mentioned above, the object gets saved to file as JSON. This gives you a data structure to work with, which you can carry out operations on, but it does also mean that you can’t just read a log from the file in a meaningful way. The truth is that the data isn’t even necessarily in order!
The flexibility of working with the object and the data is worth it, and your covered for getting the log data out in a more legible format.
Exporting Log Data
The library offers several bits of functionality that I find useful when working with log entries:
- Sorting
- Filtering
- Outputting
Sorting
All of the exports sort the log entries into order, but you have a choice over that. The order is always time-based, but you get to choose if you want it in chronological order (last log entry comes last), or reverse chronological order (last log entry comes first).
Filtering
There are three options here, and while I had considered adding in some more complex ones, I found that by choosing my types and codes well, it simply wasn’t necessary.
The first option available is to export all log entries.
The second option available is to export all entries that match a specific criteria. The criteria must be an exact match, and while you could match against the timestamp (stamp), or the text of the log entry (entry), this is where matching against the type (type) or code (code) are really intended to come into their own.
The third option does the opposite, and allows you to exclude entries that match a specific criteria.
For example you could export all log entries, just those with a type of ERROR, or everything that isn’t a code “I00”.
Outputting
There are various options for outputting the data.
- As an Alert, that simply pops it up in an additional plain text window.
- As clipboard content.
- To a new draft.
- To the cursor position in the existing draft.
- To a file, with the file name based on the path
propertyfor theTadConsoleinstance
Functions
The format produced by each function is standardised, and the output will be of the following form:
{timestamp} - {type} {code}: {entry}
For example.
2020-07-25-14.22.37.668 - ERROR [EC05]: You're turning me into a criminal when all I want to be is a petty thug. [Bart Simpson]
2020-07-25-14.22.37.790 - INFO: Shut up, brain. I got friends now. I don't need you anymore. [Lisa Simpson]
2020-07-25-14.22.38.107 - WARN [WC01]: Eat my shorts [Bart Simpson]
The function to use can be determined by referring to the following table:
| Output Type | All Entries | Include-based | Exclude-based |
|---|---|---|---|
| Alert | TA_logExportToAlert() |
TA_logExportToAlertInclude() |
TA_logExportToAlertExclude() |
| Clipboard | TA_logExportToClipboard() |
TA_logExportToClipboardInclude() |
TA_logExportToClipboardExclude() |
| New draft | TA_logExportToDraft() |
TA_logExportToDraftInclude() |
TA_logExportToDraftExclude() |
| Insert into draft | TA_logExportToInsert() |
TA_logExportToInsertInclude() |
TA_logExportToInsertExclude() |
| File | TA_logExportToFile() |
TA_logExportToFileInclude() |
TA_logExportToFileExclude() |
Interactive Preview
While exporting the log data can be useful, an alternative I find to be very useful is to use the interactive preview option. This utilises the data structure of the log entries along with code from datatables.net to build an interactive log viewer in the preview window that works on Mac, iPad and iPhone.
There are two versions of the log viewer and they are very simple to activate.
tadCon.TA_previewLogTable(true); //Display the log viewer with all fields
tadCon.TA_previewLogTable(false); //Display the log viewer with mandatory fields only
Here is a screenshot of the top of the viewer when displaying all fields.
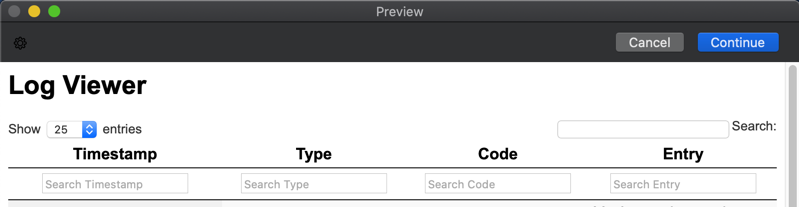
At the top left there is an option to show a number of log entries per viewer page. The options are 10, 25, 50 and 100, the default being 25.
At the top right, there is a search field that searches across all fields - timestamp, type, code and entry. This is quite useful if you want to narrow down a log to a particular time frame as you can search for the timestamp to the second for example and see just the log entries made at that time. Likewise, it is great for searching for keywords contained in log entries.
Below each column title is a field. These filter the entries in the same way as the search field, but are restricted to just that field. This gives you a more granular level of control and you can build compound queries - e.g. type of “ERROR and entry contains “not found”. They can also be combined with the search field as well.

At the bottom, the column titles are repeated. At the very bottom on the left it indicates which log entries are displayed out of how many, and at the right are the page navigation controls.
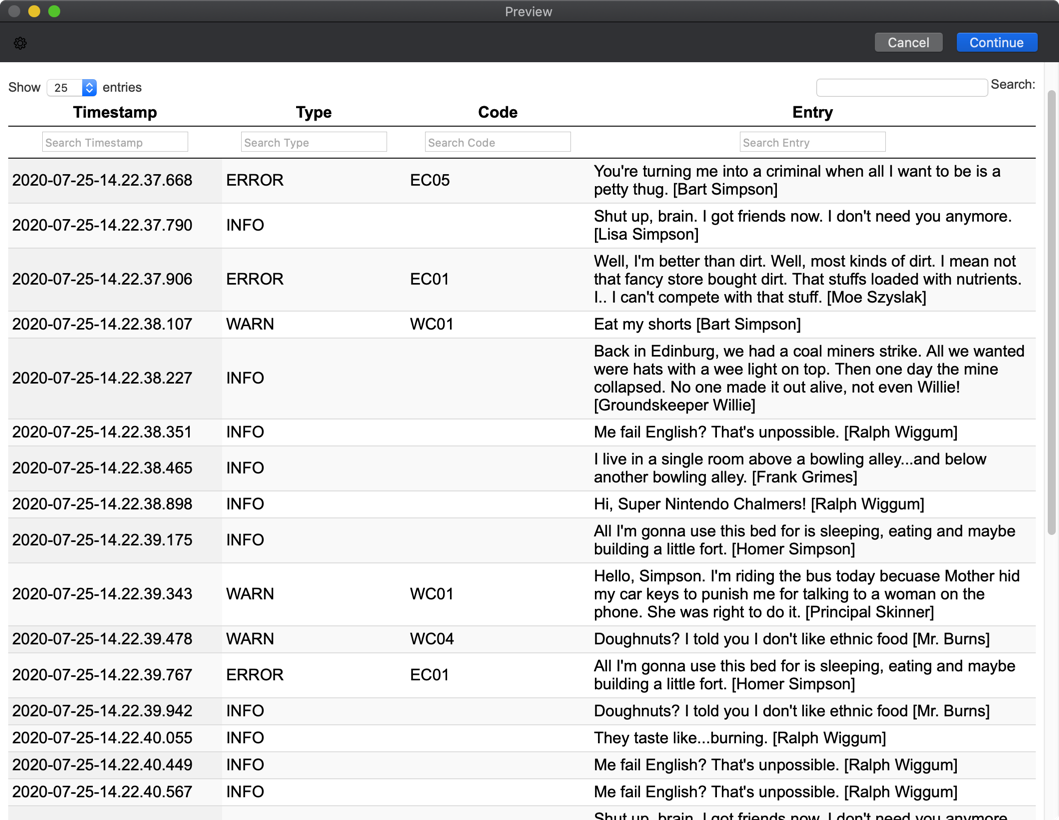
When used to view a log, the result is like this.
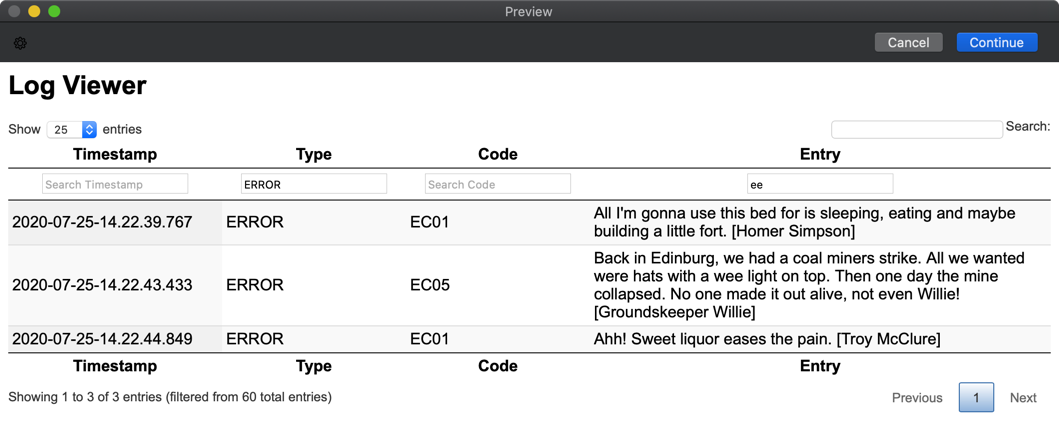
When filters are entered, the list reduces dynamically, and you get results like this.
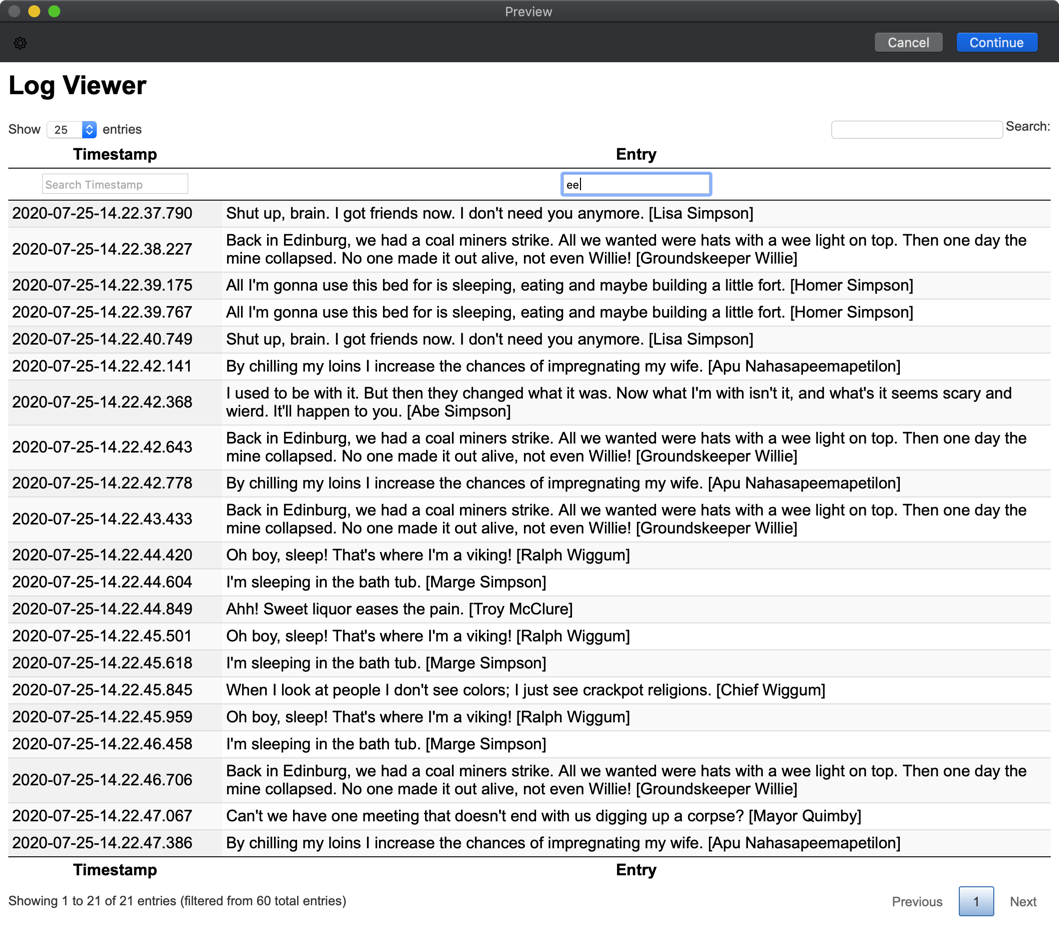
These are all examples of the viewer using all fields. If the parameter is set just to show mandatory fields, the type and code columns are not populated and the result is very similar, but simpler. If you are not using those extra fields, then this option gives you a better use of screen space as it eliminates the redundant columns.
Fake Log Entries
Before I close out this post, just a quick mention that several of the examples above are using quotations from an online The Simpsons quote generator API. It was just a quick way to get varying content in for demonstration purposes. The function to get such quotes is included in TADpoLe, I suspect I’ll get more use out of it in the future for dummy data. Just don’t blame me for the spelling mistakes!
I created an action to populate tadCon with these fake log entries and included it as an example action in the ThoughtAsylum Action Group so that people didn’t have to build the logging into a script to immediately get a bit of hands on use for how it works - see the TAD-Generate Fake log action. The script it utilises is this:
//Clear the log
tadCon.TA_clearLog();

//Populate the log object with fake entries
generateFakeLog(60);

//Save the log
tadCon.TA_saveLog();


function generateFakeLog(p_intEntries)
{
	//Initialise
	let objHTTP = HTTP.create();
	const TYPE = ["INFO", "INFO", "INFO", "INFO", "WARN", "WARN", "ERROR"]

	//Generate entries
	for (let intCount = 1; intCount <= p_intEntries; intCount+=1)
	{
		//Set a random type
		let strType = TYPE[Math.TA_randInt(0,6)];

		//Based on the type, we'll set a random code for warnings and entries
		let strCode = "";
		if (strType == "WARN") strCode = "WC0" + Math.TA_randInt(1,4);
		if (strType == "ERROR") strCode = "EC0" + Math.TA_randInt(1,5);

		//We'll add entries to the object, but we're not saving them to file.
		//For the sake of performance, we do that at the very end outside of this function.
		tadCon.TA_addEntry(objHTTP.TA_quoteSimpsons(), strType, strCode);
	}
}
First of all it clears the log, but just the instance, not any associated file. then it calls a function to populate the log, and finally, it saves the details to file.
The generateFakeLog() function uses random numbers to pick a type (there should be statistically twice as many warnings as errors and twice as many information entries as warnings), and if it is a warning or an error, it generates a random code to go with it. With that done, it adds it to the tadCon instance. A parameter of 60 is passed in to specify how many of these entries to create.
The results, you’ve seen above, and I would recommend making use of it while you try out some of the logging features for yourself, and perhaps if you extend the logging further to create your own variations.
Summary
 Hopefully, you can see some use in this logging for yourself.
Trying to debug scripts for Drafts can be frustrating at times as it isn’t a development environment and it doesn’t offer the sorts of tools that you get used to when working in a full integrated development environment. But then again that isn’t the point of Drafts. That I think is where roll-your-own solutions like this come in. I find being able to filter and structure my logging, as well as being able to create persistent log files (be they the original object JSON or exported text versions) is beneficial not only in terms of time but also of mental energy.
Give it a try. Let me know if you find it useful too, and don’t forget there’s a lot more to TADpoLe than just debugging, and I’m planning to keep growing its capabilities.