Creating An Obsidian Annual Timeline
05 Feb 2023A few days ago I published a post about a change to how I am managing my daily tasks in Obsidian. Within that post I included a bit about how I am pulling that task list through into my dashboard canvas, and this threw up a bit of interest on Mastodon with a few people asking how I had produced a timeline on my dashboard. While I provided a few pointers at the time, I promised to go through in more detail what I have in place, and that is what I will be doing in this post.
What is a Timeline?
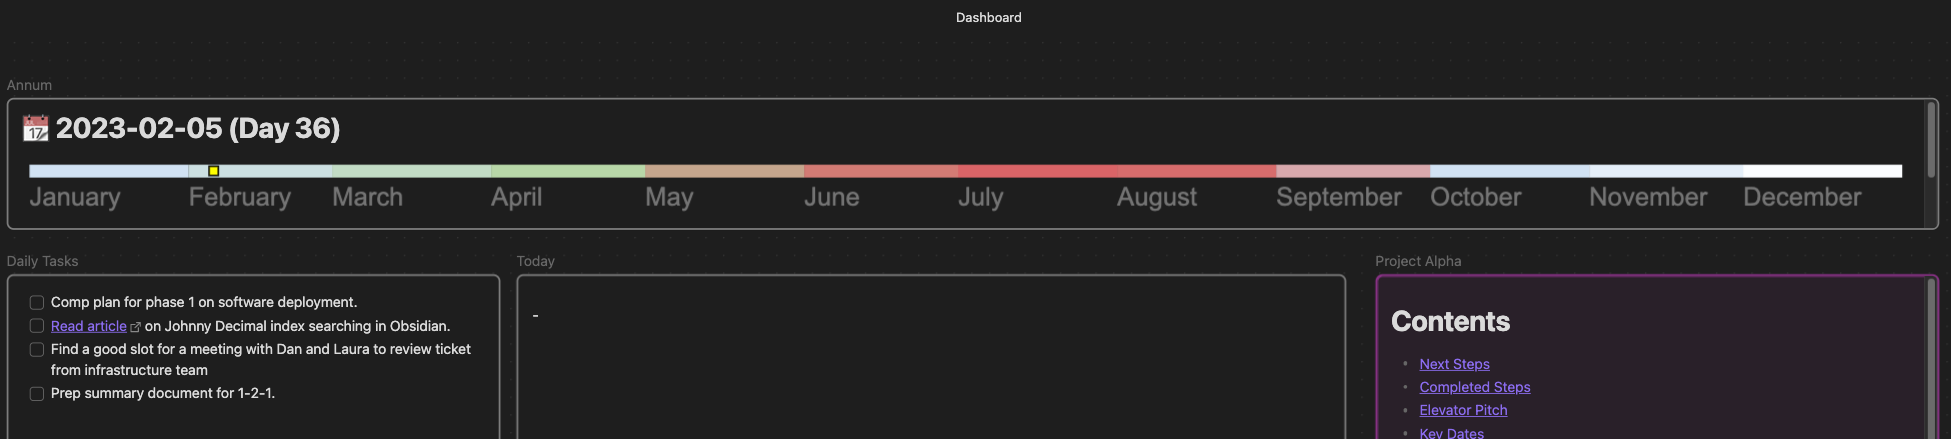
The timeline I am going to cover is shown here in the top card labelled “Annum”. It is a left to right illustration of the current year, with each month represented by a different coloured band on the line, and the current day by a yellow block.
In fact, since my take is as dynamic as I could make it, and it is based on web technology, it should work here…
The Original Idea
I need to make it very clear at this point that this idea did not originate from me. I originally saw it in topic on the Obsidian forum titled SVG Year timeline in your daily note. That post starts out with an example timeline like this to put into a daily note.
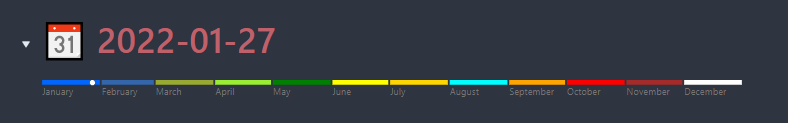
The topic currently clocks in at 60 replies, so you can see it garnered a bit of interest since it was published, and there are plenty of variations in it to suit most people’s needs.
My Take on the Timeline
You may well be asking if the original topic is so all encompassing, why are you writing anything up here? Well, I took some bits and pieces from a couple of the posts in the forum topic, but then I also did some things myself a little differently. Since there was direct interest in my dashboard I figured I should go into a bit of detail on what I ended up putting together.
The first key difference you may note is that I don’t use this on my daily note. I don’t feel I need to see that every day, for every daily note, so I just use it on my dashboard. This means that I am always interested in the current day rather than the day it was when a daily note was created. Because of that I went the route of making my timeline creation generally a bit more dynamic as you’ll no doubt pick up on below.
The second key difference is that if you read through the topic, you’ll find some discussion of “drift”, where the day marker goes off track throughout the year. There are some discussions of how to fix it, but given I was changing how the timeline was produced, I just built the calculations in so that drift shouldn’t occur. Given it worked all the way through Q4 last year, I think I must probably got it right.
Making Things Dynamic
The timeline itself is a Scalar Vector Graphic (SVG) that is specified through a series of text-based instructions that allows a browser, or a Markdown previewing app like Obsidian to render the graphic. To do this we put the SVG into a web page and embed that web page in an Obsidian Markdown note, but because we are embedding a web page, we are able to take advantage of being able to use JavaScript.
To do this, I created three JavaScript functions:
isLeapYear()- returns true if the year it is passed is a leap year.writeYear()- updates the web page with the SVG based on the current year not being a leap year.writeLeapYear()- updates the web page with the SVG based on the current year being a leap year.
The following code in the page gets the current year and then chooses what output to produce.
let intYear = new Date().getFullYear();
if (isLeapYear(intYear)) writeLeapYear(intYear);
else writeYear(intYear);
This code builds out the timeline for the current year and marks the current day on it. It will display differently each day (as long as the page it is displayed on is reloaded to trigger the redraw of the timeline).
Each of the write functions builds the SVG based on the width of a day being 10 units - which should make the maths and sizing relatively easy to follow.
The full HTML for the page (daily-timeline.html) is available by expanding the section below.
Expand to View daily-timeline.html
This should be saved somewhere in the Obsidian folder structure. The location *is* important, so do take note of it.
Creating the Annum Note
If you are already familiar with canvases in Obsidian, then you can probably tell that the timeline is included as a note. HTML files are not surfaced in Obsidian, so we need to include the timeline into a note - in my case, a note I named “Annum”.
To embed HTML into Obsidian we need to resort to the use of iframes. Never my favourite option, but it is currently the only one we have available to us to get the job done.
In order to embed the HTML we need to use a source path for the HTML file. Unfortunately, we need to use the absolute path rather than a relative one. What this means is that the full path to the file has to be specified and it needs to be the same on every device you use it on or it won’t work.
If like me you are living a multi-device, multi-platform life, then having a single path isn’t going to work. Just compare file system paths in Windows and macOS and the issue is obvious. The answer is obviously to have different dashboards and timeline files on different devices … or to choose to be smarter/lazier.
I am using the most excellent Dataview plugin for Obsidian (soon to hopefully be superseded by DataCore for Obsidian, and this includes a feature called Dataview JS that allows you to use JavaScript to interact with Dataview. This can be used to do some sophisticated querying and displays, as well as some more basic output. This last bit is what I actually utilise.
This is based on my demo vault rather than my primary vault, so it is a little simpler here, but I use a Dataview JS code block like this to specify a path on each operating system. You could apply other criteria to this, but for the purposes of illustration, I think checking the OS works pretty well, and shows you some stark differences in the file paths in use.
```dataviewjs
// Specify the path based on the OS
let strPath = 'OS Not Specified';
if (navigator.appVersion.indexOf("Win") != -1) strPath = 'file:///C:/Data/obsidian_demo/daily-timeline.html';
if (navigator.appVersion.indexOf("Mac") != -1) strPath = 'file:////Users/stephen/github/obsidian_demo/daily-timeline.html';

// Output the iframe with the source path based on the OS
dv.el('span', '<iframe width="100%" frameBorder="0" src="' + strPath + '"></iframe>');
```
This nicely brings in the daily-timeline.html page within an iframe in the Annum note.
Now you may be wondering at this point why I didn’t use Dataview JS to build the timeline in the same sort of way I did the frames. Well, you could try it yourself, but I’ll warn you that if you encounter the same behaviour as I did you will end up closing your Obsidian vault, opening the Markdown file you added the DataView JavaScript to in a text editor and removing the code to let you re-open the vault again. If you want to try, be my guest and let me know if you figure out how to get it working with that route.
You may have noticed that the Annum note also includes a title that displays a calendar image, a date stamp, and the day of the year. Once again, it is a little bit of Dataview JS that comes to the rescue and allows us to make this dynamic. This time though, using an inline query - so you should ensure you have all the inline query settings for Dataview enabled to take advantage of this.
The heading begins with an octothorpe and a calendar emoji followed by some Dataview expressions and text for the “Day”, spacing, and parentheses. Dataview is simply outputting the date information in the desired format.
# 📆 `= dateformat(date(now), "yyyy-MM-dd")` (Day `= dateformat(date(now), "o")`)
Putting these together, the Annum note content is as follows:
# 📆 `= dateformat(date(now), "yyyy-MM-dd")` (Day `= dateformat(date(now), "o")`)
```dataviewjs
// Specify the path based on the OS
let strPath = 'OS Not Specified';
if (navigator.appVersion.indexOf("Win") != -1) strPath = 'file:///C:/Data/obsidian_demo/daily-timeline.html';
if (navigator.appVersion.indexOf("Mac") != -1) strPath = 'file:////Users/stephen/github/obsidian_demo/daily-timeline.html';

// Output the iframe with the source path based on the OS
dv.el('span', '<iframe width="100%" frameBorder="0" src="' + strPath + '"></iframe>');
```
Conclusion
With the Annum note created, you can include it in your dashboard just like any other note; so there’s not really any interesting ideas for me to share around that one.
It took me a while to figure out all the bits and pieces, but in the end I had a timeline that worked precisely for my needs that could give me a high-level view of where I was in the year via my dashboard canvas. Hopefully, this walk through will help you too and allow you get the same dynamics that I enjoy - being able to deploy a current annual timeline (with no “drift”) on multiple devices with varying vault locations.
If you are interested in doing more with Obsidian, don’t miss out on my other Obsidian posts, there may be some other tips and tricks to be had.